Category: R
-
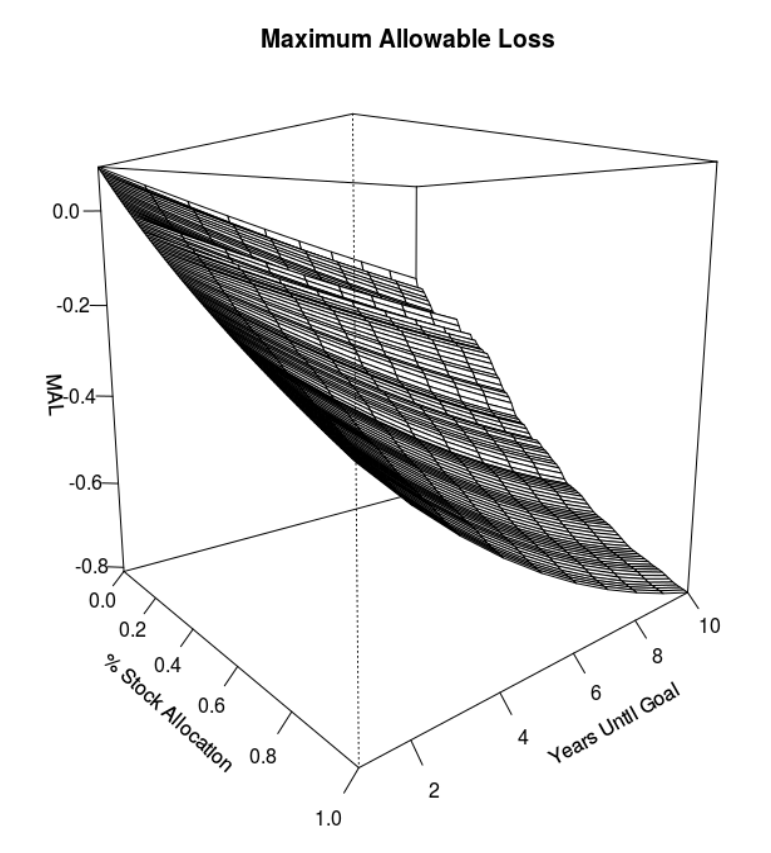
How Much Can You Lose Before You’ve Lost Too Much?
I started my career in finance in 2007. For about a year I thought “this is great!” Then 2008 hit and I thought “this is terrible!” After 2008, I had one fundamental question that I wanted answered: how much can you lose in an investment portfolio before you’ve lost too much? After about five years…
-
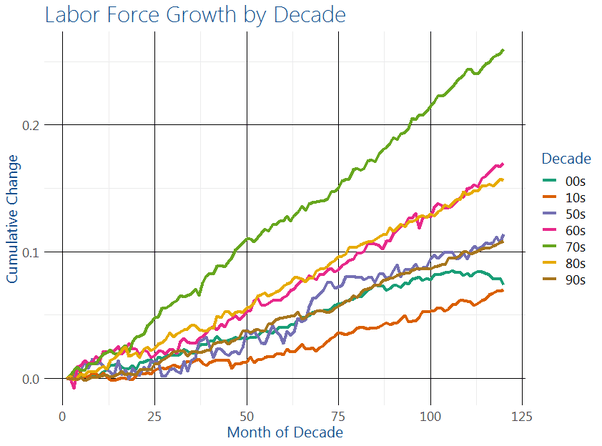
Labor Force Growth by Decade – R Code
I just posted an interesting look at the growth of the labor force by decade. Given that I used R to produce it, I thought it interesting to share the R code and method. Just for reference, here is the chart: First, we will need the following libraries The quantmod library is a significant reason…
-
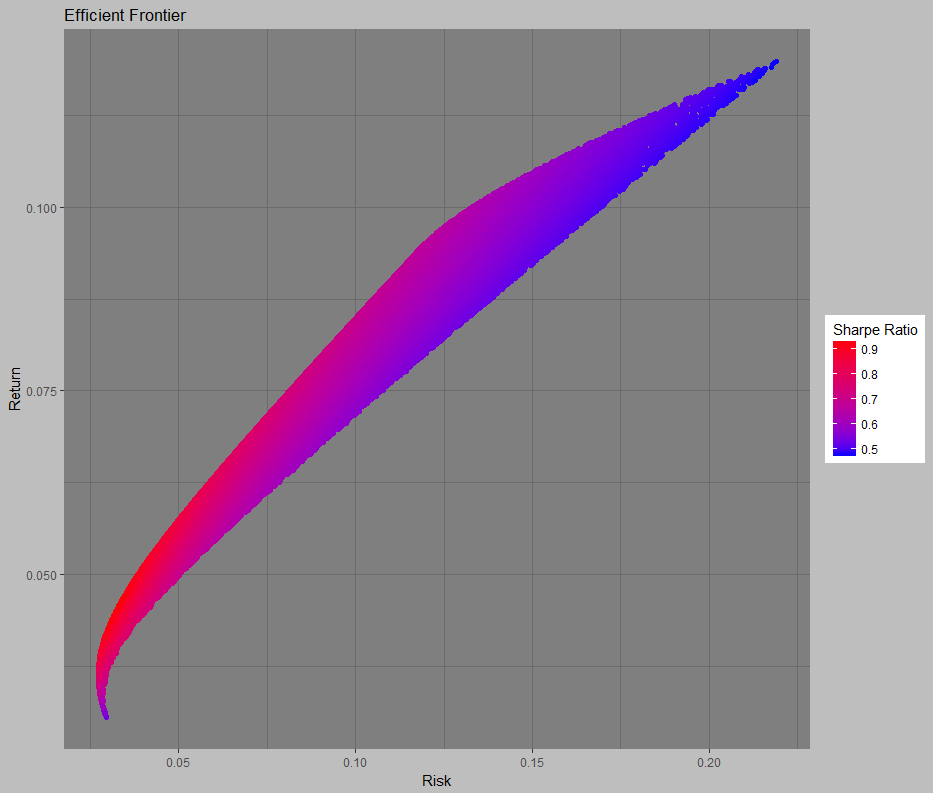
Optimizing a portfolio in R – Monte Carlo method
I regularly use monte carlo engines to answer questions. First, they are really flexible in their ability to model non-normal distributions and assumptions. Second, you can incorporate any constraints you want which may be outside the scope of a non-linear optimization function. At any rate, this is how to use R and a Monte Carlo…
-
PerformanceAnalytics — An Indespensible Quant Tool for any Investor
I’m in the thick of our annual portfolio investment due diligence at work. Basically, this involves surveying all the potential investments we could hold in our portfolios, and then deciding whether we should continue to hold what we own or switch to something else. It is a big job, involving lots of data analysis. I…
· R -

NNET in R — A Quick Tour & Test
I spent some time today learning the nnet package in R. nnet makes building, training, and predicting with neural nets really easy. Here is a quick tour. Keep in mind, my objective here is to get a sense of the package, rather than demonstrate how it could be used. In addition, I have drawn heavily…
· R
